


Document Actions
Tech Tips | CueMix FX | Audio Analysis Tools Part One - FFT Analysis

CueMix FX Audio Analysis Tools Part One: FFT Analysis
The latest models of MOTU FireWire/USB/Thunderbolt (non-AVB) audio interfaces are built with CueMix FX, which includes expanded mixing and signal processing features. Additionally, CueMix FX units have several handy audio utility tools (found under CueMix's Devices drop-down menu) designed to help you analyze any input, output or mix bus's signal. We'll take a look at each of these in this five part series.
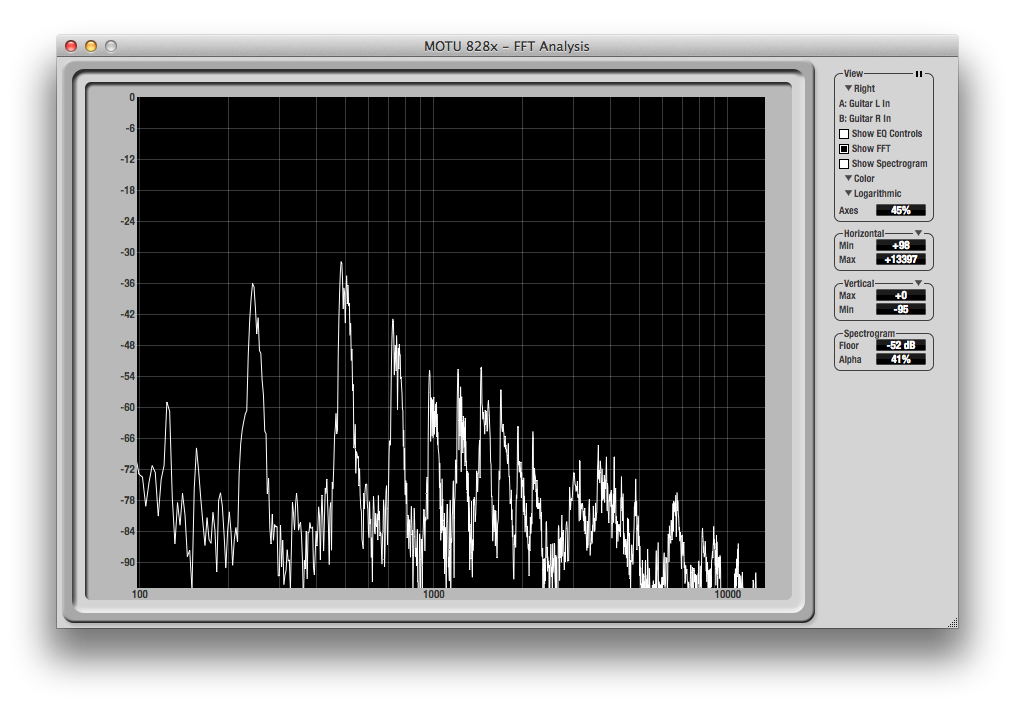
The first audio analysis tool to check out is the FFT Analysis window. The FFT Analysis window displays a realtime Fast Fourier Transform frequency measurement (Amplitude vs Frequency) for whichever input, mix bus, or output channel pair is in "Focus", (use a channel's Focus button in the main CueMix window to change the FFT Analysis window's target).
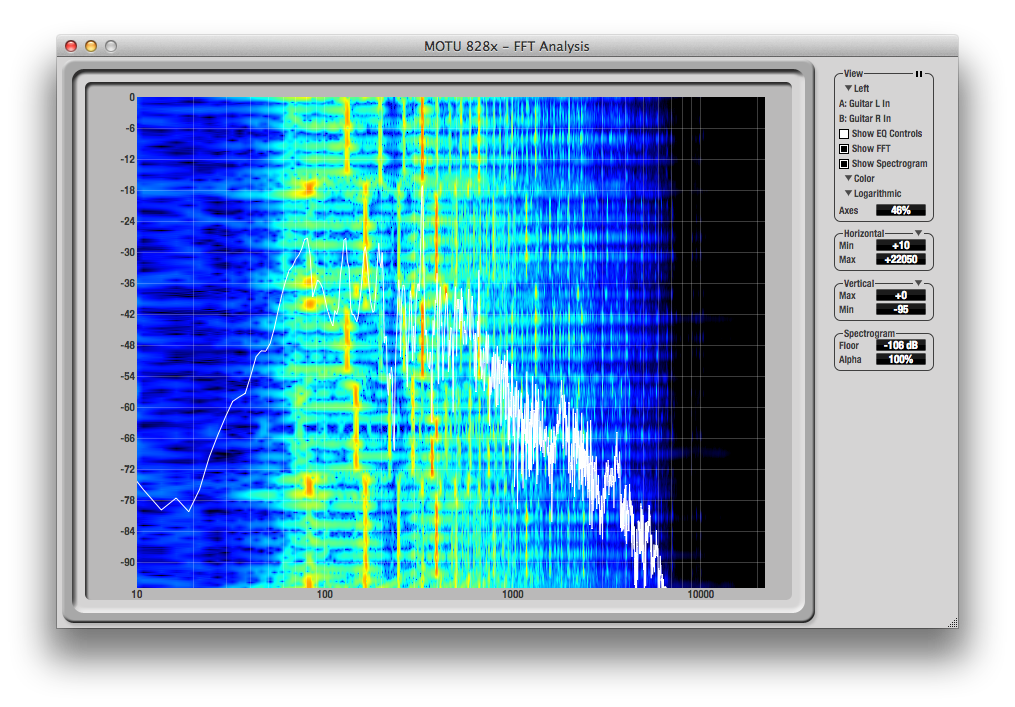
The FFT Analysis window can be resized to fit your full screen by clicking and dragging on the bottom right corner. In the right column, several controls are provided to help configure your window, the main three controls being "Show EQ Controls", "Show FFT", and "Show Spectrogram". Independent of the FFT Analysis, you can turn on or off the Spectrogram, which displays the same Frequency vs Amplitude information as a falling "waterfall". Scrolling from top to bottom, the Spectrogram provides colorful feedback to describe your signal's amplitude plotted over frequency. Colors range from Black (minimum) -> Blue -> Green -> Yellow -> Orange -> Red (maximum).
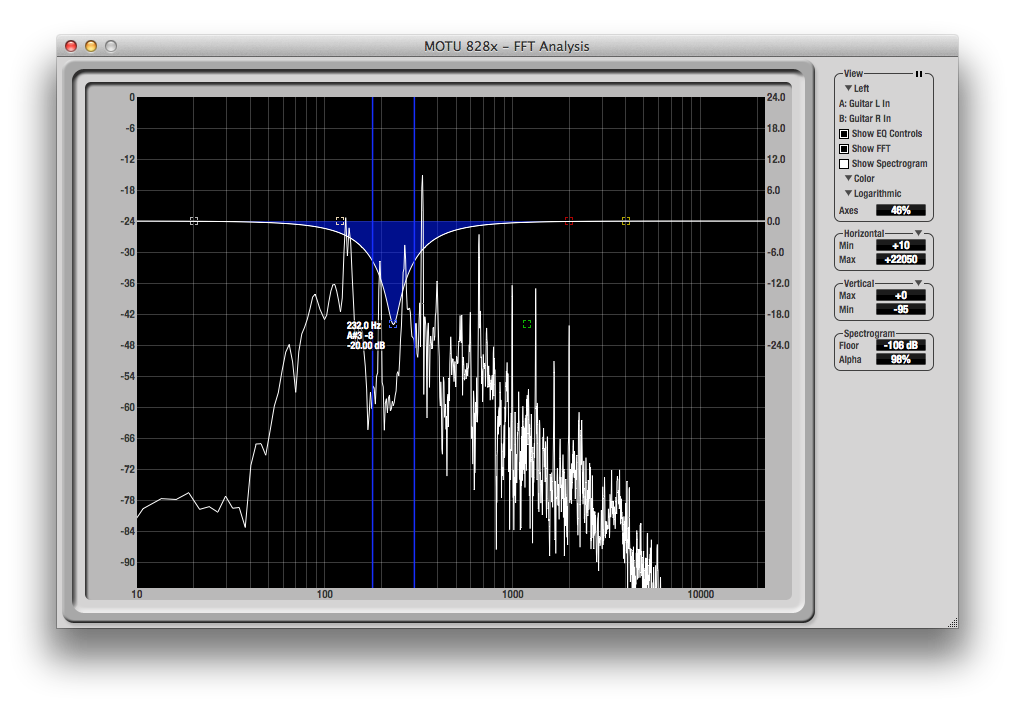
The same FFT and Spectrogram information can be found in the filter response display above the EQ tab in the main CueMix window. When working in the EQ tab, use the disclosure triangle on the bottom left of the filter response window to turn the FFT or Spectrogram display on or off. However, the advantage of using the FFT Analysis window is its ability to be resized to full screen, a more comfortable layout when showing larger ranges of amplitude and frequency information. Along the same lines, enabling the EQ Controls button in the FFT Analysis window, enables the window's duel purpose, coupling the EQ tab with your other FFT features, giving you full-screen, realtime control of your channel's EQ settings.
Note: Be sure to check out this Tech Tip for some handy EQ shortcuts you can use on the EQ handles in the FFT window.
One benefit to using the FFT Analysis window when making EQ changes, is that the FFT Analysis is post-filter, meaning you can see how your EQ adjustments affect your signal visually, in realtime. Use the FFT response to help visually identify necessary EQ changes, (although, you should always default to using your ears!).
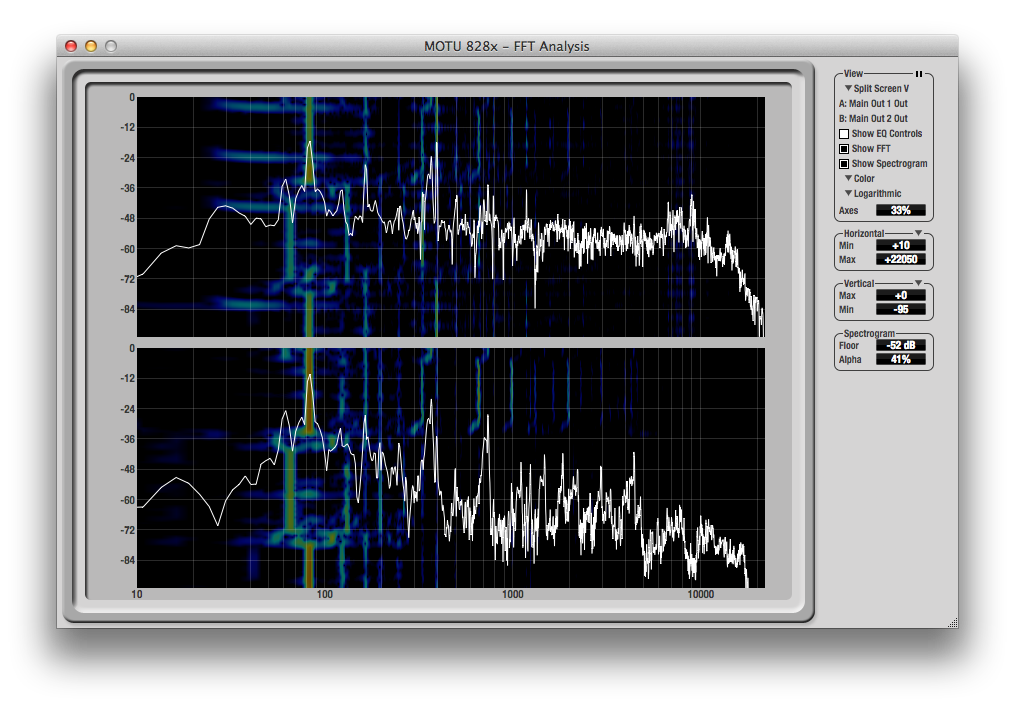
Back in the FFT controls section, there is a pause button on the top right, where you can pause the analysis at any time. The disclosure triangle under the word "View" provides a drop-down menu with different view options, ideal for splitting your stereo channels into two windows, subtracting their difference, or using the "Shared" view. The channels in Focus are shown by the "A:" and "B:" listings. Notice how they update when you put another channel in Focus.
Note: If selecting a mono input as the Focused channel, the FFT Analysis window shows a stereo input in most View settings; change the View to Left or Right to see your mono input signal individually
The FFT window defaults to "Color", where the FFT analysis line is white, and the Spectrogram shows the colors described above. Setting the window to "Grayscale" changes the FFT Analysis to red, which overlaps a Gray-scaled Spectrogram nicely. The FFT window's display and calculations can be set to either Logarithmic or Linear, and the Axes' opacity can also be set to your liking by adjusting the Axes setting.
Lastly, use the Horizontal and Vertical Min and Max settings to define the range of the FFT window. The Spectrogram Floor setting sets the amplitude threshold for the spectrogram display (from -144dB to 0dB), and the Alpha control sets the opacity (from 0 to 100%).
The FFT window is a great way to dive into your input or output channel's signal for detailed frequency analysis, and provides a full-screen alternative to CueMix's EQ tab.

Keep reading for Audio Analysis Tools Part Two: Oscilloscope »
Want to see your tip as a MOTU Tech Tip? Is there a feature, technique, or configuration you would like to learn more about? Send us your tips, or topic suggestions »