


Extras

Optical expansion
Need more inputs and outputs?
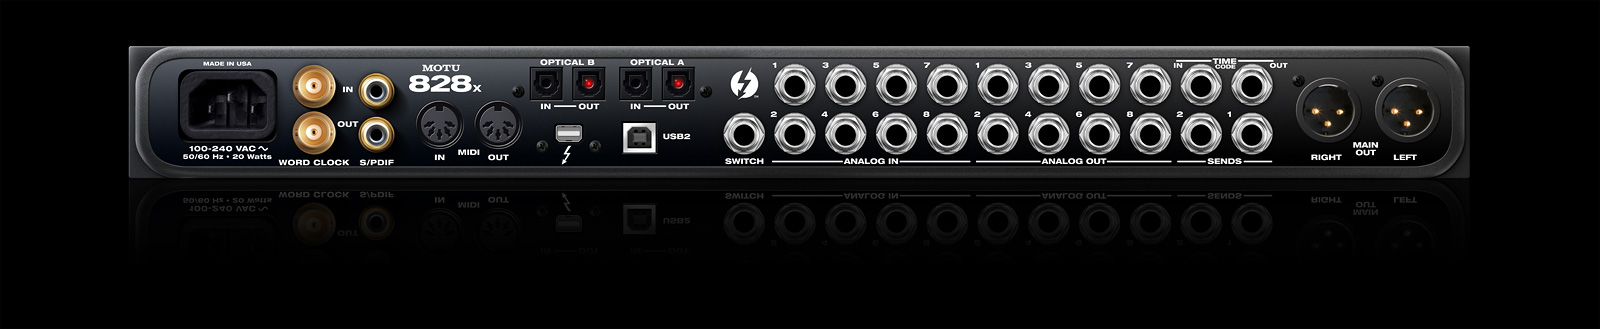
Connect a MOTU 8pre to the 828x's optical input and you now have an additional eight mic inputs with individual preamps. Or connect any optical device to further expand the inputs and outputs of your 828x system. Best of all, the optical ports are fully integrated into the 828x's on-board mixing environment, with seamless side-by-side operation with all other 828x channels.


MIDI I/O
Connect your MIDI gear directly
The 828x provides MIDI input and output featuring sample-accurate timing with supporting software. Connect a MIDI keyboard, sound module or control surface, and you are ready to go. The Thunderbolt or USB connection to the computer carries both MIDI and audio so you don't need to connect an additional USB cable for MIDI.
Direct SMPTE time code sync
No separate synchronizer required
You can resolve the 828x directly to SMPTE time code, without a dedicated synchronizer, using the dedicated time code input, or any analog input. The 828x employs DDS, a DSP-driven phase-lock engine with sophisticated filtering that provides fast lockup times and sub-frame accuracy. This technology represents the very latest in high-performance, yet cost-effective digital audio clocking. DDS also allows the 828x to maintain an extremely stable clock while resolved to incoming clock sources that have substantially more jitter than the 828x itself.

SMPTE Console software
Synchronization made easy
The included MOTU SMPTE Console™ software (for Mac OS X and Windows) provides a complete set of tools to generate SMPTE for striping, regenerating or slaving other devices to the computer. Like CueMix FX, the synchronization features are cross-platform.

Instrument Tuner
Accurately tune guitars and other instruments
Just open the Tuner window, play a note, and use the large graphic display to get in tune with an accuracy of one 10th of a cent (one 1,000th of a semi-tone). Being in tune has never been easier. The Tuner displays the detected note by frequency (in Hertz), note name and octave, with an adjustable reference frequency for A4 between 400 and 480 Hz. The large meter gives you a clear indication of how high or low you are from the detected pitch. Large red arrows direct you up or down as needed to zero in on the correct pitch. You can even tune phase-coherent stereo signals. The CueMix Tuner is as advanced and accurate as any dedicated hardware tuner out there.
Spectrogram "waterfall"
A cascade of information — in vivid color
Observe rich, detailed visual information about the frequency content of any signal or mix. You can expand the spectrogram to fill the entire resizable CueMix on-screen window. You can also combine the spectrogram with the FFT in the same display, as shown below, or separate them to view them individually but simultaneously.
FFT display
Visualize your frequency content
Visually monitor the frequency content of your music or other audio material as it plays. The CueMix software superimposes a Fast Fourier Transform directly on the spectrogram display so that you can see the relationship between the two for the audio material being monitored.


X-Y Plot
Check phase alignment with visual clarity
The X-Y Plot window graphs a stereo signal on a standard grid with left-channel amplitude on the x-axis and right-channel amplitude on the y-axis. Stereo material that is said to be "in polarity" (i.e., phase aligned) appears along the x = y axis. Stereo material that has phase problems will appear along the x = -y axis meaning the signal will appear predominantly in the upper left and lower right of the display. A signal with an extremely wide stereo field will appear much more randomly (not along either axis).


Phase Analysis
Check for phase cancellation when summing to mono
In the polar view, the radius represents frequency and the angle (theta) from the +y vertical axis represents the phase difference of left channel minus the right channel. Stereo audio that is generally in phase will appear along the +y axis (above the center point). The more the audio signal "tips" to the left or right, the more out of polarity it is. If it is completely out of phase, it will point downwards from the center point and hover around the -y axis (the part of the y axis below the center point).
The Phase Analysis window graphs frequency versus phase difference versus amplitude of a stereo signal on either rectangular or polar coordinates. In the rectangular view, the vertical axis represents frequency, and the horizontal axis represents the phase of the left channel minus the phase of the right channel. Stereo audio that is predominantly in polarity will appear centered along the center vertical axis. Frequencies that would be canceled by summing to mono are those that touch the -1.0 or +1.0 lines on the left and right.


Applications for phase analysis
Phase analysis can be used for a broad range of applications
in the studio and on stage. Here are just a few ideas.
Recording with multiple mics
The Phase Analysis window lets you compare multiple mic sources with each other to check for potential phase cancellation caused by varying distances in mic placement from the recorded source.

Checking overall polarity
Quickly check the overall polarity in your stereo mix for phase issues.

Summing to mono
If your stereo material needs to be summed to mono, Phase Analysis lets you see what frequencies will be canceled out when summed.

Tuning PAs or sound reinforcement
Place mics in strategic locations in your venue to check for critical phase issues in the listening environment.

Oscilloscope
This is not your grandpa’s oscilloscope…
CueMix’s oscilloscope delivers a robust feature set combined with digital precision. Amplitude is displayed on the y-axis and time is displayed on the x-axis. The pause button lets you “freeze” the real-time display and then zoom in to the sample level for closer examination. You can choose among several different displays for stereo signals, including combined (as shown below) or split screen. The Waveform Recognition feature searches through new audio data looking for matching waveform data, and the trigger options let you specify detailed criteria for displaying the incoming signal’s waveform in the display. The oscilloscope can be used for a variety of daily studio tasks, such as analyzing and comparing harmonic content, closely inspecting transients such as drum hits, comparing timing between two signals, and performing clip detection. You can even use the oscilloscope to help you build synth patches and check them for non-obvious issues, such as DC offset.

Thunderbolt and the Thunderbolt logo are trademarks of Intel Corporation in the U.S. and/or other countries. All other trademarks are the property of their respective owners.